Using Dimensions & Segments in Google Analytics to Propel Your Content Marketing

As online marketers, we all have great web metrics at our fingertips….or do we?
Using hard facts to support business decisions requires two things: reliable data and knowing the key performance indicators of the business in an online context.
I have been using Google Analytics for 10 years (since just months after the Urchin acquisition), and I have seen some great customizations of this massively popular web metrics tool. However, it is common for organizations to not even scratch the surface of what Google Analytics can offer.

Using mere headline engagement statistics, like bounce rate, without a web metrics strategy can lead to some bad decisions.
While I’m sure some of you Kissmetrics readers are already champions of Google Analytics, in this post, I will cover some tips that might help you create your own analytical setup in A/B testing, social media, AdWords, and content marketing, as well as some of the slightly newer Google Analytics features.
So, let’s get into it.
Measure User Engagement and Transactional Revenue with A/B Testing
User engagement and transactional revenue can be measured with A/B testing.
For the free version of Google Analytics, get yourself an Optimizely account (also free – up to 50,000 monthly unique visitors) so you can build variations for A/B and multi-variate testing. You can set up a “custom dimension” integration with your Optimizely experiments within Google Analytics to view traffic sliced and diced as you please.
Once the “custom dimension” integration is set up for you, you can build custom reports within Google Analytics. Instead of navigating into Reporting, start with Customization from the top navigation.

Create a new custom report.

Then, build your report to include whatever Metric Groups you are interested in – user engagement and/or transactional data. Click on “+ add metric,” and type in your metric.
It’s key that you select the right dimension for Dimension Drilldowns and Filters and apply a regex that is the experiment ID from Optimizely.

Once you have saved your custom report, you can view the buckets of session data against the A/B tests.

This is powerful data. You can have up to 20 Google Analytics integrated tests running at any one time providing you with classic user engagement statistics as well as “the sharp end” of conversion-led data.
In the test results below, we see major improvement from enhancing the design of a shopping cart “search” function to make it more prominent. Check out how the variation wins on conversion rate:

Measure the Popularity of Web Content at a Page Level
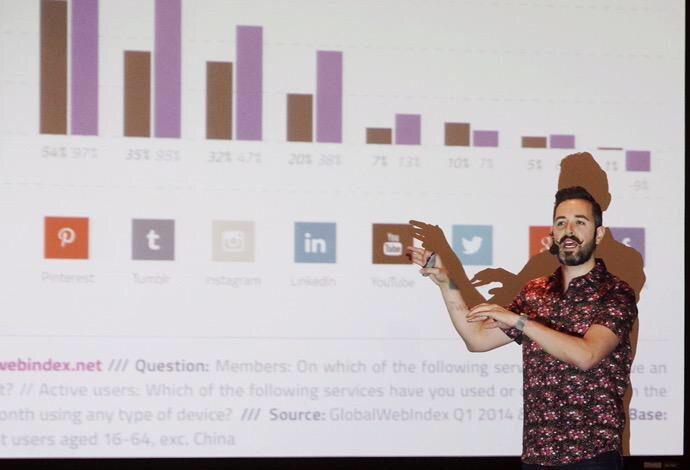
The popularity of web content can be measured in visitors and shares. For social media gurus and content strategists, it’s great to measure key social actions at a page level.
With this information (tracked as events), you can review a blog section more effectively, understanding the visitor/share picture instantly to support the direction of future blogging or content creation. View the data within …read more
Source:: Kiss Metrics Blog
![]()
![]()
![]()