 View Upcoming Digital Marketing, Media and Advertising Conferences & Exhibitions
 Phone:

Posts Tagged "The Human Counter-Trend"



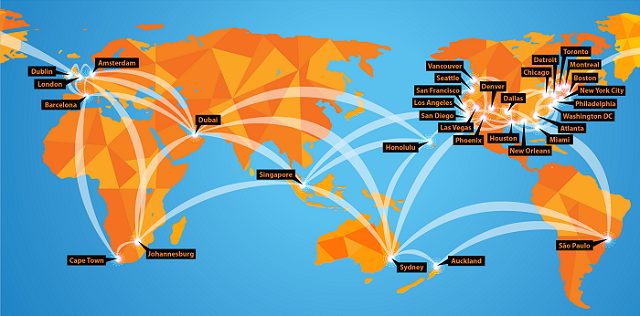
DigiMarCon is the Largest Digital Marketing, Media and Advertising Conference & Exhibition series in the world, with annual events held in all continents (North America, Latin America, Europe, UK, Asia Pacific, Middle East and Africa) in 13 countries (United States, Canada, Australia, New Zealand, United Kingdom, Ireland, Netherlands, Spain, Brazil, Singapore, India, United Arab Emirates and South Africa), across 33 cities (New York, Philadelphia, Boston, Toronto, Vancouver, Montreal, Houston, Dallas, Chicago, Los Angeles, San Francisco, Seattle, Washington DC, New Orleans, Atlanta, Detroit, Miami, Denver, San Diego, Phoenix, Las Vegas, Honolulu, London, Dublin, Amsterdam, Barcelona, Johannesburg, Cape Town, Dubai, Sydney, Auckland, Singapore and Sao Paulo). All DigiMarCon Events can be attended in-person or online. Wherever you are located there is a regional DigiMarCon event nearby you can attend.

DigiMarCon Conferences are held in top luxury 5-star event venues across the world such as; Royal Caribbean Cruise Ships, Olympic Stadiums, Marina Bay Sands Expo & Convention Centre and Wynn, JW Marriott, Marriott Marquis, Hyatt Regency, InterContinental, The Westin, Renaissance, Hilton, Conrad, W, Sheraton, Loews and Sofitel Hotel properties. Discount hotel room rates at each venue hotel means no hassle getting to and from the venue each day.

Building relationships matter! At DigiMarCon Conferences we have more networking breaks on our program than others. On average there are 8 Networking breaks at each event giving delegates ample opportunities in a relaxed atmosphere to meet others over the 2-days at the event; from 1-hour round table networking luncheons to 3-hour dinner receptions. These networking breaks are set in picturesque locations to facilitate memorable experiences while fostering new relationships. Such experiences include enjoying cocktails and the Sunset over the Pacific Ocean on a private Ocean Terrace in Santa Monica, to being on the Sydney Olympic Stadium playing arena at night enjoying cocktails under the lights, to dining at the 360 Revolving Restaurant at the top of the CN Tower in Toronto for a Dinner Reception, enjoying cocktails on a private promenade overlooking Times Square in New York City, or having fun at the Dazzles Night Club onboard the Royal Caribbean Oasis of the Seas for a Farewell Party, etc.
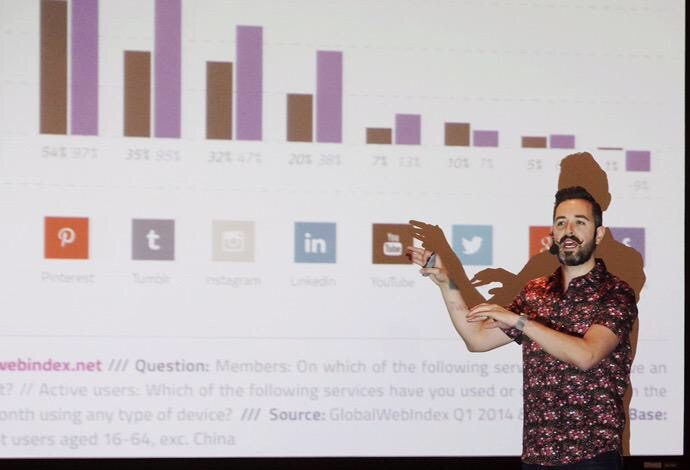
DigiMarCon Keynotes, Panels and Master Classes are facilitated by the foremost thought leaders in the industry, from celebrity social media influencers to CMO’s from the largest Fortune 500 company brands that are disrupting the digital marketing, media and advertising industry, such as Google, Facebook, Microsoft, Amazon, Oracle, Adobe, eBay, Netflix and more. All presentations are pitch-free, and include actionable takeaways, case studies, strategies and tactics, ready to be applied when back in the office.
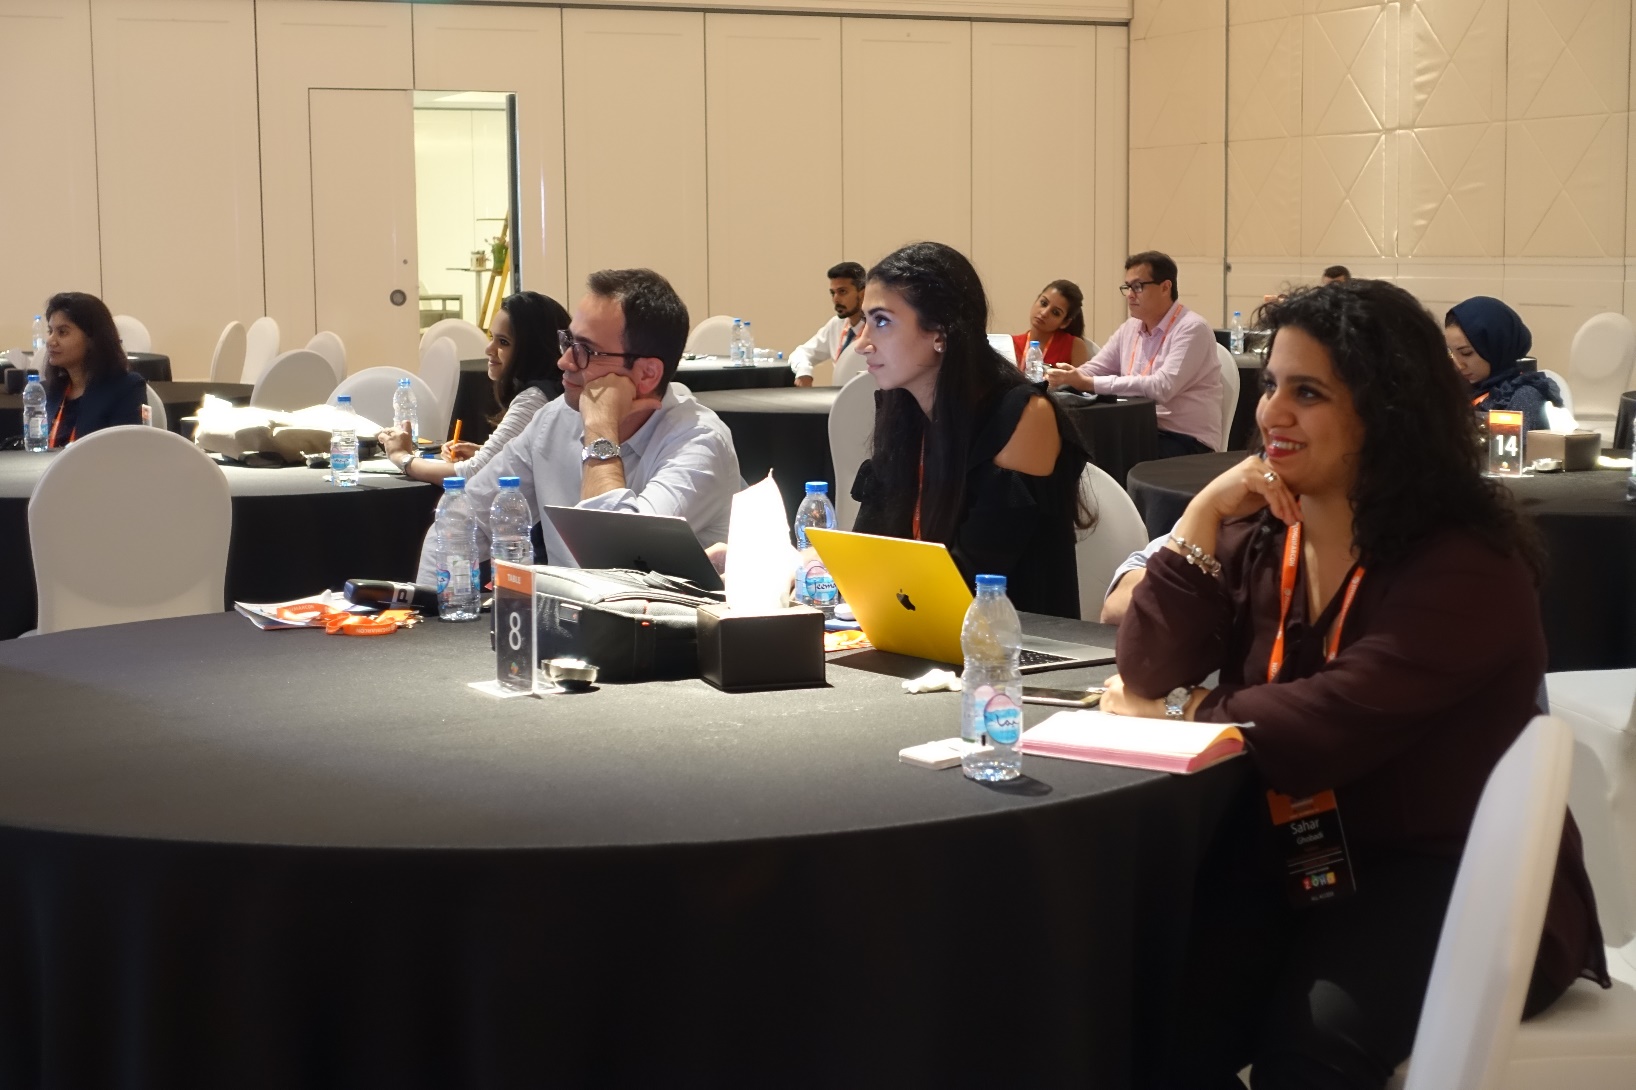
At DigiMarCon Conferences you are never ‘left in the dark’…. literally, in a large room far away from the stage and speakers, crushed in tight theater seating, without even a table, while sitting in the dark. At DigiMarCon all delegates have premium meeting space in luxurious ballroom well-lit spaces, with comfortable seating with table enabling delegates to use their laptop to take notes with ample charging facilities onsite in a comfortable space to learn and thrive. All tables are situated close with direct view of the stage.

DigiMarCon Conferences are affordable to attend, from single-day event passes up to two-day VIP options at a fraction of the cost of other industry events. We offer significant discounts for early bird registrations. Additionally, on top of time-limited discount pass rates, because budgets are tight, we want to make sure all groups have a chance to attend DigiMarCon. For government employees, students, academic, startups, non-profit organizations and teams, we offer generous discounts off the prevailing registration price.
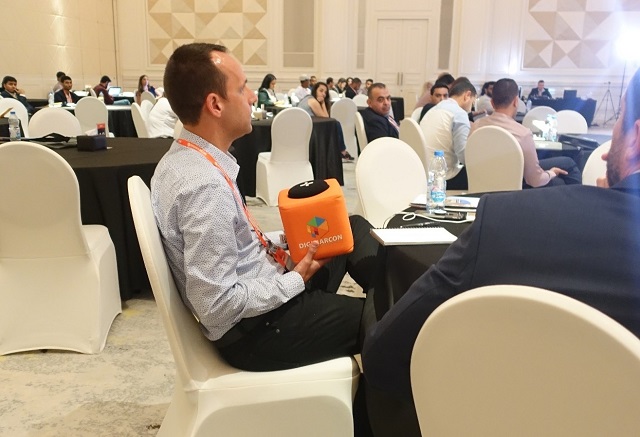
Attend DigiMarCon and you become part of the show! DigiMarCon Conferences tap into the talent of the room, drawing from the knowledge and experience of the professionals in the audience. All DigiMarCon events include regular interactive question and answer sessions with speakers and the audience ideal for collaboration, audience polls, along with ice-breaker and group exercises, steered by charismatic Emcees.

DigiMarCon Conferences put you right up and close with the speakers giving you the opportunity to meet these social media influencers which you follow in person. Speakers are never hidden in private speaker rooms away from the audience, they are in the auditorium sitting right beside you and participating.

Attending a conference is a well-researched decision. There are many factors to consider such as location, time, venue, cost, speakers, content, etc. At DigiMarCon our results-obsessed Customer Service team are at your service before, during and after the event to help with your needs. It’s at the core of what we do — it drives our business. Offsite, we are ready to assist you via phone, ticket or chat. Onsite at our Conferences, friendly DigiMarCon staff serve as your hosts. They welcome your input and are happy to assist you.

At all DigiMarCon Conferences is the co-located exclusive event TECHSPO Technology Expo, which showcases the new generation of technology and innovation, including; AdTech, MarTech, Internet, Mobile and SaaS technologies. Be inspired, amazed and educated on how these evolving technologies will impact your business for the better. Unlimited Access to TECHSPO Technology Expo is included with all DigiMarCon passes.
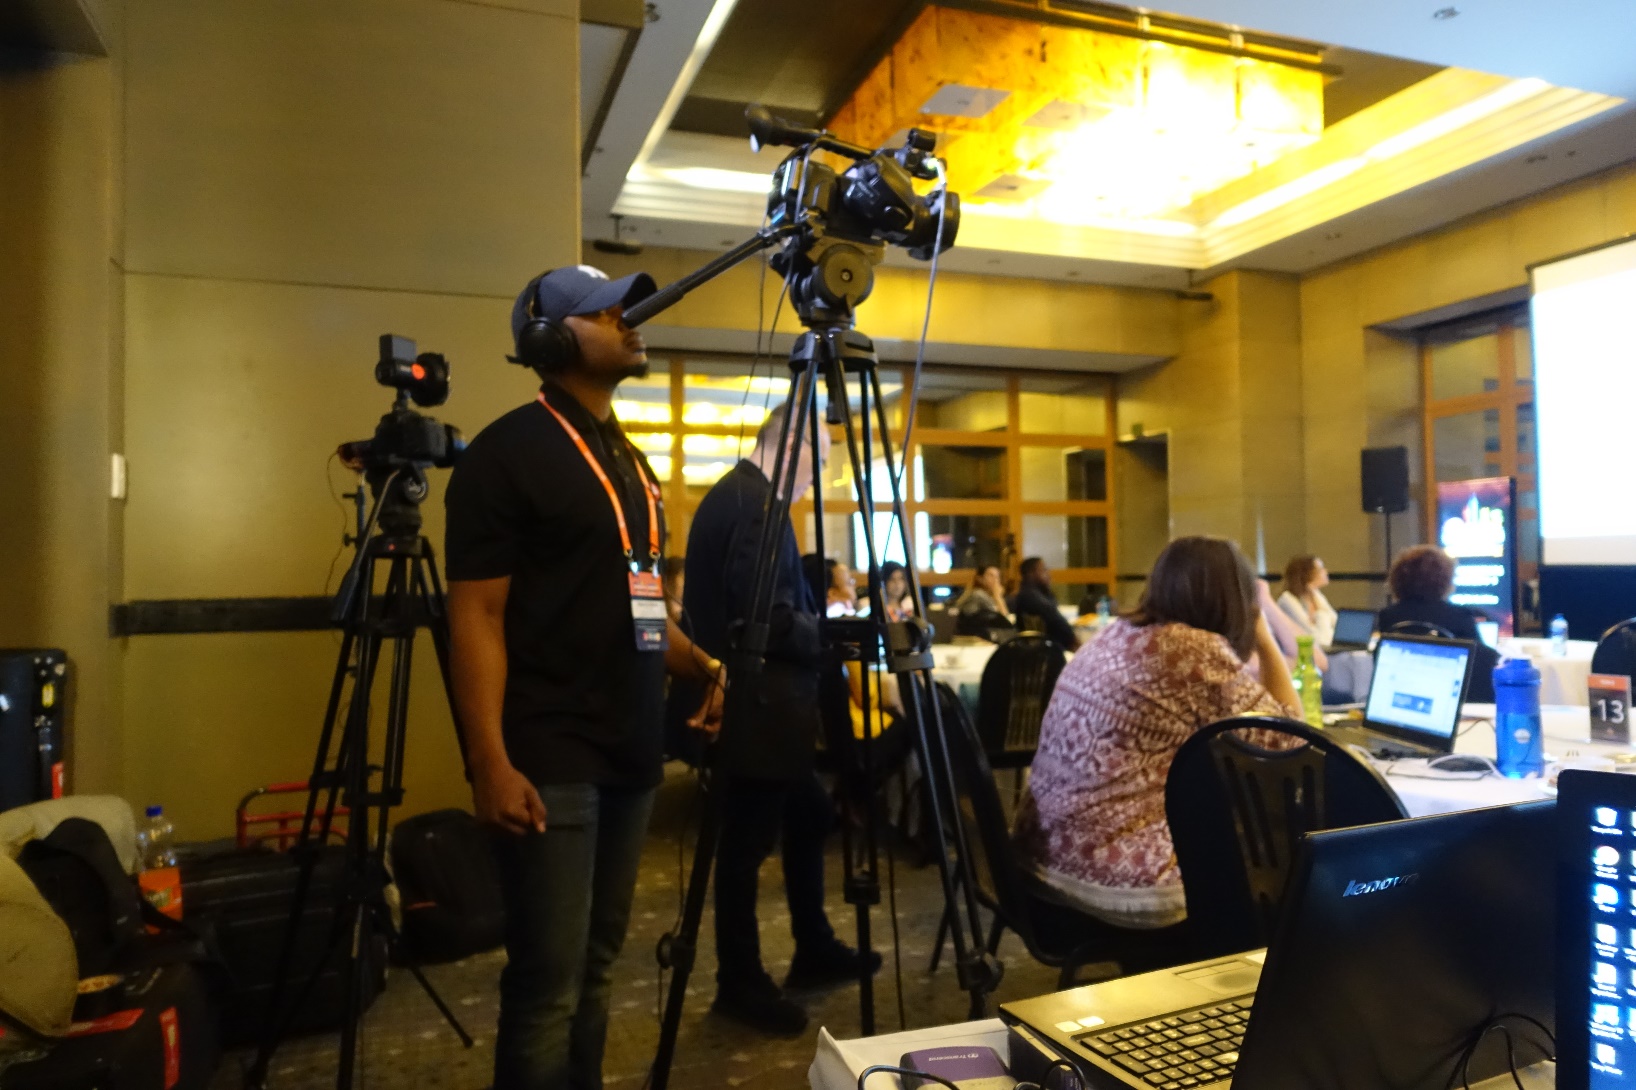
DigiMarCon All Access & VIP Passes include a 12-month on demand access to hundreds of hours of DigiMarCon speaker keynotes, panels and master class presentations from recent DigiMarCon Conferences, including videos, slide decks and key takeaways, available on demand so you can watch what you want, when you want.
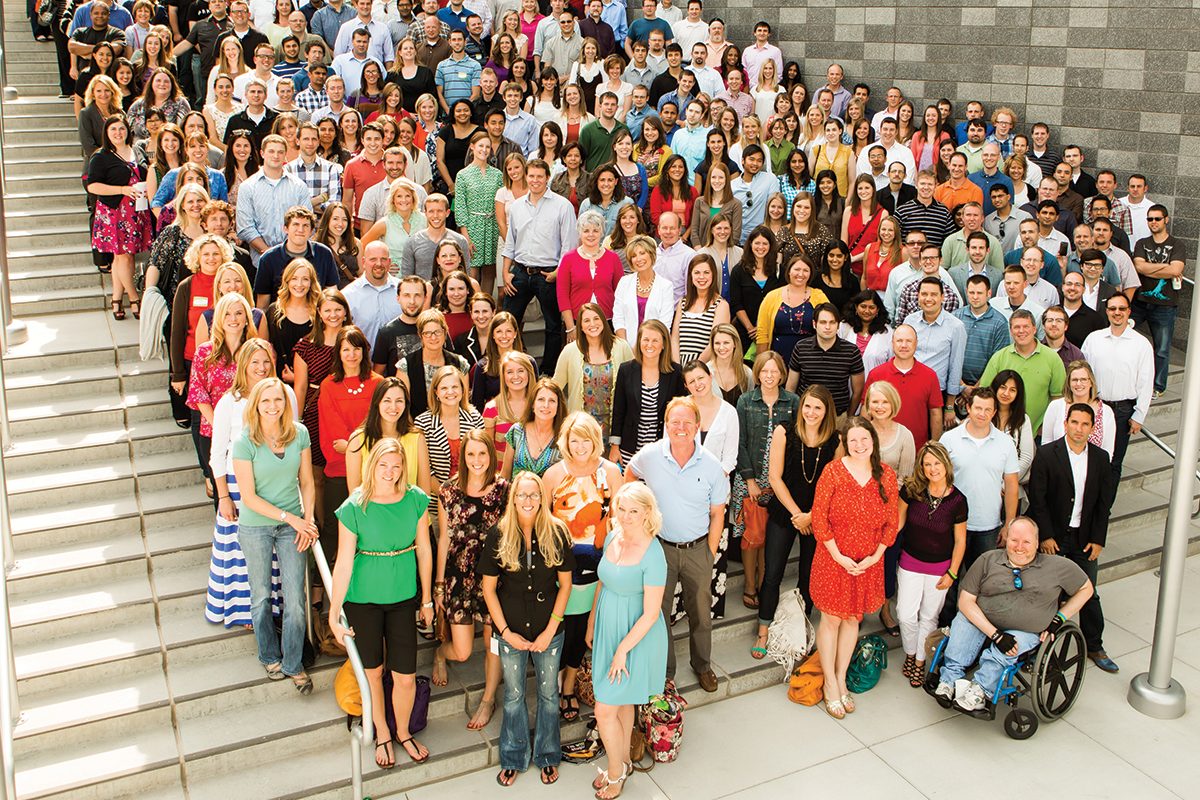
Attendees of DigiMarcon Conferences gain membership to an exclusive global Digital Marketing, Media and Advertising Community of over 500,000 worldwide subscribers to our award-winning digital marketing blog and over 100,000 members to the International Association of Digital Marketing Professionals (visit https://iadmp.org). This global community comprises of innovators, senior marketers and branders, entrepreneurs, digital executives and professionals, web & mobile strategists, designers and web project managers, business leaders, business developers, agency executives and their teams and anyone else who operates in the digital community who leverage digital, mobile, and social media marketing. We provide updates to the latest whitepapers and industry reports to keep you updated on trends, innovation and best practice digital marketing.

The events industry has forever changed in a world affected by COVID-19. The health and safety of our guests, staff and community is our highest priority and paramount. The team at DigiMarCon is dedicated to ensuring a great experience at our in-person events, and that includes providing a safe, clean and hygienic environment for our delegates. Some of the key areas we have implemented safe and hygienic measures include;

DigiMarCon has always been industry leaders of the Hybrid Event experience for years (a hybrid event combines a "live" in-person event with a "virtual" online component), no one needs to miss out on attending our events. Each DigiMarCon Conference can be attended in-person (with a Main Conference, All Access or VIP Pass) or online (with a Virtual Pass) giving attendees a choice for the experience they want to have. Attending virtually by viewing a Live Stream or On Demand enables participation by people who might be unable to attend physically due to travel or time zone constraints or through a wish to reduce the carbon footprint of the event. If you would like to meet the speakers, network with fellow marketing professionals at refreshment breaks, luncheons and evening receptions, check out the latest Internet, Mobile, AdTech, MarTech and SaaS technologies providers exhibiting then it is highly recommended to attend DigiMarCon in-person. As the largest Digital Marketing, Media and Advertising Conference series with events in 33 international cities worldwide, across 13 countries, there is bound to be a DigiMarCon Event near you to attend in-person if you can.

DigiMarCon Conference Series is the annual gathering of the most powerful brands and senior agency executives in your region. The Sharpest Minds And The Most Influential Decision Makers - Together for Two Days.
Who Attends Our Conferences
Brands • Agencies • Solution & Service Providers • Media Owners • Publishers • Entrepreneurs • Start-Ups • Investors • Government • Corporates • Institutes of Higher Learning




The Human Advantage: Why Real Connection Is Still the Digital Currency
In 2026, the world is still adding people, but its population growth rate is far below its mid-1960s peak. The Human Counter-Trend is a change in the pace of human history, not a claim about personal connection.
The annual population growth rate is the yearly percentage change in the total population. It can fall while the number of people keeps rising, much as a slower-growing balance can still become larger.
That distinction matters in a digital world filled with fast-moving data and large claims about what people need. Population figures describe headcounts and change over time; they do not measure the value or effects of human connection or digital engagement.
This report uses demographic estimates to explain what is changing, where growth is concentrated, and what projections can show. A declining rate and a growing headcount are compatible, and that distinction is the key to reading today’s demographic change.
The Human Counter-Trend: Why Population Growth Is Slowing
The annual growth rate is now less than half its mid-1960s high, even as the world continues to add tens of millions of people each year. In 2026, the global growth rate is 0.84%, compared with around 2% at its peak.
A lower growth rate means the total is increasing more slowly, not that the world population is shrinking. The estimated annual increase is 69,065,325 people, so the headcount still climbs even as the percentage rate falls.
That difference explains the Human Counter-Trend today: rapid population growth has given way to slower growth, while the global population continues to rise. A counter-trend moves against a stronger earlier direction; it does not automatically reverse that direction.
The growth rate compares the yearly change with the population already living. The number added per year measures the actual increase in people. Those figures answer different questions, and one cannot replace the other.
A large population can add many people even when its annual percentage change is modest. The same percentage rate can also mean different numbers of people when it applies to populations of different sizes.
For that reason, a falling rate alone does not show that fewer people live on Earth. It shows that yearly population growth has slowed from its earlier high.
Read the percentage rate and the number added per year as separate measures.
How Many People Are Alive in 2026?
The estimated world population on October 18, 2026, was 8,321,373,118. That is more than eight billion people, but the exact-looking figure is an estimate tied to one date, not a count verified person by person.
About 80% of the October 18, 2026 headcount is 6.66 billion people. This share is a simple portion of the estimated total, rather than a separate population measure.
A date matters because the population changes through births, deaths, and migration. A world population figure quoted without its date can look current while describing an earlier point in time.
The global median age was 31.1 years in 2026. Median age divides the population into two equal groups, with half younger and half older than that age.
Readers looking for the world population in digits can use the dated estimate above. It gives a precise number, but that precision should not be mistaken for a continuously verified census.
The world population number is also not a fixed total for all of 2026. It represents an estimate for October 18, built from demographic data rather than a live count of every person.
Whenever a headcount is quoted, keep its date attached.
How the World Population Reached Eight Billion
It took until 1804 for the world to reach its first billion people, while the eighth billion arrived in 2022. The population graph of these milestones shows closer gaps between later thresholds.
The world crossed eight billion in the first half of 2022, according to the revised United Nations series. That year marked a population milestone, not the start of population growth.
From the first billion to four billion
The first billion took many centuries to reach. Later, the next three billion arrived over a much shorter span, showing that the total began to rise faster.
The faster climb from five billion to eight billion
After four billion, the gaps between each billion-person mark stayed short. The world added three more billion people between 1974 and 2022.
A world population graph based on these dates rises more steeply across recent centuries. It traces the size of the population, not the yearly growth rate, which can change on a different path.
The shrinking gaps between milestones show acceleration in the total, not an endlessly rising growth rate.
What We Can Estimate About the Earliest Human Population
Estimates for 10,000 B.C. span from 1 million to 10 million people, a wide range that signals the uncertainty of prehistoric counts. Those figures are reconstructions, not results from a census or a record of every birth.
No dependable world population number can be given for 1,000,000 B.C. The evidence cannot support a precise count for that distant period.
Researchers infer early population size from limited clues about settlement, food, and human remains. Those clues can support broad estimates, but they cannot establish a reliable exact total for all people alive at one time.
For around 8,000 B.C., the world population was approximately 5 million. That estimate sits within the much wider range given for 10,000 B.C., and the dates are not interchangeable.
A search for the world population in 1,000,000 B.C. cannot produce a sound figure. Human history reaches far beyond the period for which population evidence can support a confident estimate.
For early periods, even a broad estimate may depend on how researchers interpret sparse evidence. A single number can hide that uncertainty and suggest a level of accuracy the record cannot provide.
Treat early population figures as broad estimates, not exact historical tallies.
Is the Population Counter Accurate?
A world population counter is an estimate that updates between dated population figures, not a live tally of every person. Its displayed total depends on a model and the population series behind it.
The UN-based counter starts from 8,266,245,291 people on January 1, 2026, then uses a straight-line estimate to January 1, 2030. That calculation fills the gap between dated estimates.
Population estimates combine information from censuses, surveys, and vital records. The UN population series uses 1,910 censuses and 3,189 surveys, as well as birth and death registers.
A census counts people during a set period, while surveys collect data from samples. Birth and death registers add records of vital events, but the systems differ across countries.
Country figures from the U.S. Census Bureau total about 1.3%, or 108 million, fewer people than the UN series. This gap shows that population estimates can differ across methods and data sets.
Neither total is a real-time count. A counter can update often and still rely on a model rather than direct observation of every birth, death, and move.
The displayed number can be useful for tracking a modeled trend. Its digits do not make it an exact count of people alive at that second.
Treat the displayed total as a model tied to a population series and a date.
How Many People Have Ever Lived on Earth?
Estimates put the number of people ever born at about 117 billion. That total includes people who have died and people living now.
About 7% of all people ever born are alive today. The share puts the current population in perspective, but it is not a record of individual lives.
The Population Reference Bureau estimates how many people ever lived on Earth by combining assumptions about past population size and birth rates. The deeper the estimate reaches into the past, the less complete the record becomes.
The total is necessarily a historical estimate, not a count of every person born. Many births occurred before written records, and early population sizes remain uncertain.
About 117 billion is a rounded estimate, not an exact tally. It includes people across human history, whether they lived for a short time or reached old age.
The living share helps compare people alive today with all people ever born. It should not be read as a count of named individuals or a measure of their lives.
Use the living share as a sense of scale, not as a count of individual lives.
How Fertility Shapes the Future Population
The global average fell from 3.31 children per woman in 1990 to 2.25 in 2024. Fertility rate means the average number of births per woman, while total births count babies born across a population.
Falling fertility can slow population growth without making the total number of births fall at once. The number of women in each age group also affects how many births occur.
Fertility has fallen across recent decades
The global fertility rate has moved closer to replacement level over recent decades. Annual births still reached 146 million at their 2012 peak, even as average family size declined.
Girls staying in school longer and wider access to contraception are linked to declining fertility. They are among the factors associated with changes in birth patterns.
Replacement level is not an immediate population stop
Replacement level is about 2.1 births per woman. It is the average fertility rate at which a population replaces itself over time, under typical conditions.
Reaching that level does not mean every family has the same number of children. Nor does it erase the effects of past birth patterns or the population’s age structure.
Annual births count all babies born in a year; fertility measures average births per woman. Those measures can move differently as the number and ages of potential parents change.
A fertility rate near replacement level does not make a large population stop growing at once.
Why Population Keeps Growing After Fertility Falls
A lower average number of children per woman does not erase the large generations already moving into adulthood. Their age structure can keep births numerous even when average family size falls.
Population momentum is continued growth caused by the age structure of a population. It differs from high fertility because it can persist after fertility has declined.
When many young people reach parenting ages, the number of potential parents rises. Even if each woman has fewer children on average, the total number of births can remain high.
Population momentum accounts for 79% of projected global population growth to 2054, or about 1.4 billion people. The number of women of childbearing age is expected to rise toward 2.2 billion in the late 2050s.
Those figures describe the role of age structure in future growth. They do not mean that every country will follow the same path or that births will rise everywhere.
Longer survival also keeps people in the population for more years. When deaths occur later, the total can remain larger even without a rise in average fertility.
Births and deaths both shape population change, while migration shifts people between places. A falling fertility rate alone cannot capture all three forces.
Population momentum makes age structure a key part of any forecast.
Where Population Growth Is Concentrated
Asia remains the largest population center, while Africa accounts for much of the projected increase. In 2026, Asia had 4,863,327,397 people and Africa had 1,584,985,259.
Sub-Saharan Africa is projected to add 788 million people by 2050, or 57% of net world population growth. Present size and future growth point to different regional patterns.
Asia remains the largest population center
Asia’s large population reflects its scale today, not a guarantee that every country in the region will keep growing. The region includes places with different birth rates, age profiles, and migration patterns.
Africa accounts for much of future growth
Africa is expected to account for a large share of future population growth, with Sub-Saharan Africa responsible for much of the projected increase. That forecast describes a regional total, not an equal rise in every country.
Europe is expected to see a declining population. A falling regional total can occur alongside growth elsewhere, so a global average can hide local change.
These contrasting paths show why global population growth does not describe every region well. A single rate can combine growth, stability, and decline in different places.
Regional change also affects the way people interpret population data. The number of people living in a region today and the amount it may add later are separate measures.
Compare both present population size and future growth when describing regional change.
Which Countries Are Driving the Population Shift?
India was the world’s most populous country in 2026, ahead of China. India had 1,476,625,576 people, compared with China’s 1,412,914,089.
India overtook China around 2023, changing the top spot in the population ranking. A country’s current population and its future contribution to growth are not the same measure.
Seven countries are expected to account for just over half of net population growth from 2026 to 2050. Their combined role is large, but the projection does not mean each will add the same number of people.
Migration can change a country’s population, but births and deaths also shape its total. A large country may grow slowly, while a smaller one may have a faster growth rate.
The India-China comparison describes population size at a point in time. The seven-country group describes expected contributions to future net growth.
Separate current population rankings from which countries contribute most to future growth.
How Population Age and Life Expectancy Are Changing
Older adults are projected to form a larger share of the world population as the century advances. People aged 65 and older made up about one in ten people in 2026.
That share is projected to reach one in six by 2050 and nearly one in four by 2100. The age profile changes even as the total population grows more slowly.
Older age groups are a growing share
A larger share of older people can affect the number of people in working ages. The size and timing of that change will differ across countries.
Population aging can also raise the need to plan for pensions and health services. These are pressures that governments and communities may face, not fixed outcomes for every place.
Longer lives change the population profile
Global life expectancy at birth was 73.3 years in 2024. It is projected to exceed 77 years by 2054, reflecting longer survival in the population.
Life expectancy at birth estimates how long a newborn would live if current death rates continued. It does not predict the lifespan of a particular person.
Longer survival means more people may live into older age groups. Fertility, deaths, and migration still affect how each country’s age structure develops.
Age structure helps explain why population change matters even when the total grows more slowly.
How Many Humans Will Be on Earth by 2050?
The UN medium-fertility projection puts the world population at 9,664,378,587 on July 1, 2050. This is the central estimate for that date under the United Nations medium-fertility projection.
The UN gives an 80% chance that the 2050 total will fall between 9.5 billion and 9.8 billion. That interval is a probability range, not a second point estimate.
Many people who will be alive in 2050 are already living today. Their ages and survival will shape the future total, alongside births and deaths in the coming years.
The projection depends in part on assumptions about fertility and mortality. A change in either can shift the estimated population, even when the starting point remains the same.
The exact July 1 figure gives a central estimate, while the probability range shows that future totals are not certain. The two figures serve different purposes.
Population prospects are clearest when a projection includes both a date and its uncertainty. The date marks the forecast point, and the range reflects possible variation around it.
Read the central projection alongside its uncertainty range.
When Will the World Population Peak?
The UN medium projection places the world population peak in 2084. It estimates a total of 10.29 billion people at that point.
The same projection puts the world population at 10.2 billion in 2100, after the peak. A peak means the modeled total reaches its high point before a slower decline.
The world population peak is a projection, not an event that can be dated in advance with certainty. Future births, deaths, and survival can change the path and the year it reaches its highest point.
A lower total after the peak would not mean that population change stops. The model points to a gradual shift from growth to decline, rather than a sudden fall.
India is projected to remain the most populous country in 2100 under the UN medium projection. This ranking is part of that projection and does not make the global peak a country-level event.
Population prospects depend on the assumptions used to build the model. A different path for fertility or survival could alter both the size and timing of the projected peak.
A projected peak is a turning point in the model, not a precise date that can be observed in advance.
How Reliable Are Long-Range Population Prospects?
A long-range population projection is sensitive to assumptions about future fertility and survival. The longer the forecast reaches, the more room there is for those assumptions to affect its result.
The UN gives a 95% probability range of 9.1 billion to 11.4 billion for the world population in 2100. That wide range reflects uncertainty, not a set of exact outcomes.
Fertility assumptions shift the long-range totals
The UN medium projection assumes a slight fertility rebound in countries already below two children per woman. The Institute for Health Metrics and Evaluation projection assumes no rebound.
Different assumptions can produce different population totals even when models begin with similar data. A small change in average births can add up across many countries and years.
Life expectancy in 2300 cannot be stated reliably
A population forecast estimates the size and structure of a population. It does not forecast how long any one person will live.
A dependable global life-expectancy figure for 2300 cannot be given. Changes in medicine, living conditions, disease, and other factors make such a far-reaching estimate uncertain.
Projecting a near-term life expectancy far into the future would treat current conditions as fixed. That would not account for major shifts that could occur over many generations.
Long-range population prospects can help compare possible paths, but their details depend on assumptions. Figures should not be read as promises about the future.
Treat estimates beyond the current projection horizon as increasingly uncertain, not as exact outcomes.
What a Global Headcount Leaves Out
A global headcount describes how many people there are, not how every population is categorized or what each person consumes. Population data alone cannot answer questions about identity or personal impact.
No single standardized worldwide race classification supports a reliable global majority or a dependable 2050 count of white people. Categories differ across countries and are not measured in one shared system.
Population size is also different from environmental demand. In 2023, the average ecological footprint was 2.56 global hectares per person, while total human demand equaled 1.71 Earths.
Per-person greenhouse-gas emissions were 7.7 tonnes in 1990 and 7.8 tonnes in 2019. Total emissions rose 54% over that period, showing that a small change per person can sit alongside a larger rise in total emissions.
A headcount does not show how resources or emissions are shared among people. It also cannot tell how a country defines race or how those categories compare with another country’s labels.
Claims about population, impact, and identity answer separate questions. Mixing them can make a statistic seem to prove more than it does.
Keep population size, individual impact, and identity categories separate when interpreting demographic claims.
Conclusion
The central demographic shift is a slower rate of increase, not an immediate end to population growth. A falling growth rate can occur while the number of people continues to rise.
Population projections describe possible futures, not guaranteed outcomes. Their results depend on assumptions about births, deaths, and survival.
When comparing population estimates, check the date and the measure first. Before sharing a population figure, check its date, measure, and projection variant.